Other FIT Wellington pages:
- A New Public Transport Approach
- A Suggested Route
- Advancing Light Rail for Wellington
- Advocacy or Consultancy
- Are we on track
- Art of Light Rail Insertion
- Auckland Light Rail Options
- Briefing to Transport Minister
- Bus and Light Rail in Central Wellington
- Bus Rapid Transit is Unsuitable
- By the Numbers
- Can Light Rail Attract Enough Demand
- City of Well Connected Communities
- Congestion Free Wellington
- Draft GPS on Land Transport
- Estimating Travel Time
- FIT Wellington
- Funding Light Rail
- Glossary
- Golden Mile Trial
- Letter to Capital Magazine
- LGWM Options Feedback
- LGWM Personal Submission
- LGWM Submission
- Light Rail Costs
- Light Rail Design Brief
- Light Rail FAQ
- Light Rail Options Survey
- Light Rail Planning Assumptions
- Light Rail to Lincolnshire Farms
- Making Tram-Train Work
- Mass Rapid Transit in Wellington
- Ministerial Talking Points
- Move More People with Fewer Vehicles
- Moving on from LGWM
- Myth Busters
- N2A Talking Points
- NZTA Talking Points
- Open Letter on Trackless Trams
- Open Letter to LGWM
- Paul Swain Monday 1 February 2016
- Planning Principles
- Public Transport in Wellington
- Public Transport Spine Issues
- Public Transport Spine Study
- Public Transport Spine Workshop
- SH 1 Wellington Improvements
- Spatial Plan Submission
- The Case for Light Rail
- Three Minute Summary
- Towards Low Emission Cities
- Track Gauge
- What Makes Light Rail Succeed
- What Next for Transport in Wellington
- Workshop Code of Conduct
What lessons can Wellington take from Canberra’s light rail project?
PDF settings (show)
Demand.
Residential densities in Wellington are roughly double those in Canberra, with roughly twice as many users within walking distance of stops.
Comparable city densities show regional population density in Wellington is nearly double Canberra’s (population weighted density 37.8 people/ha versus 20.8 people/ha). Along Canberra’s light rail corridor, the population density is 13.1 persons/ha (1.5 km corridor), rising to 26.0 persons/ha (400 m corridor). In contrast, substantial areas of Te Aro, Mt Cook, Newtown, Berhampore and Kilbirnie are over 50 persons/ha.
Greater population density in Wellington will improve light rail viability, with more people within walking range (the FIT route is chosen to maximize patronage). This should outweigh greater capital costs per kilometre (Zoo and Airport tunnels).
Space.
Wellington’s narrow streets are tight for light rail (FIT has assumed a tram width of 2.4m, although 2.65m would be better and should be possible) but a greater barrier to BRT. Buses do not have the luxury of multiple width options, and also require greater clearances than a fully guided vehicle.
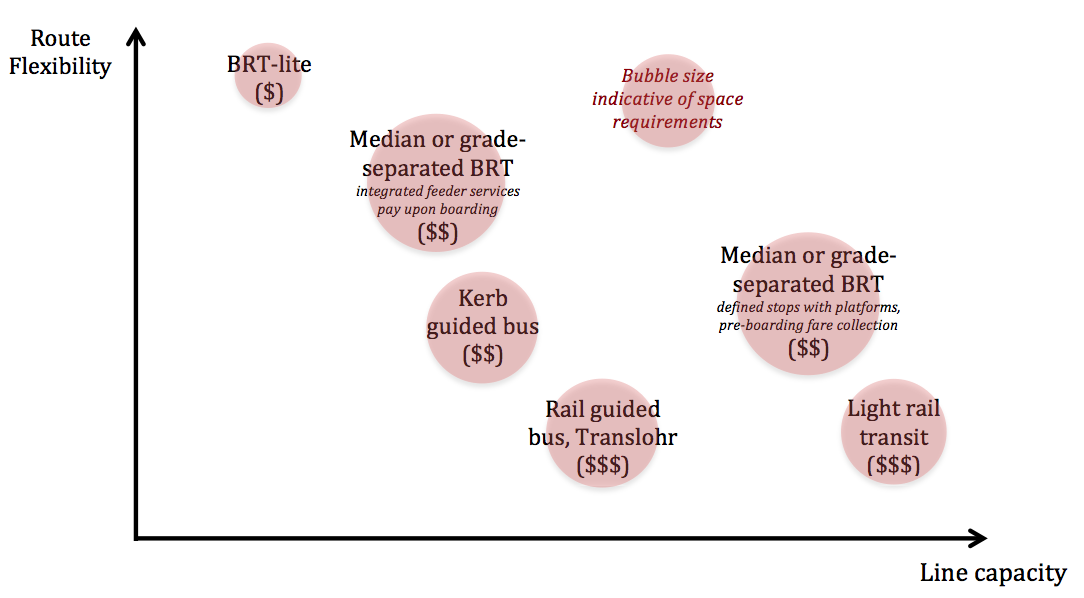
Comparison between light rail and bus rapid transit shows the space needs (bubble-size) and route capacity (horizontal axis) of public transport options (Emerging Technologies for Rapid Transit, Part I page ii). BRT-lite is small-bubble, low-capacity and cannot be compared with light rail. Large-bubble BRT can match light rail capacity but is too big for the golden mile.

An artificial barrier to light rail in Wellington is an unrealistic definition of BRT. Distinctions between Bus Priority and Bus Rapid Transit are unclear in the Public Transport Spine Study and give no sense of the differences in scale. The Spine Study seems to have claimed the benefits of high-capacity BRT, while expecting the costs and space-requirements of BRT systems carrying substantially fewer buses than central Wellington carries at present. This leads to two unrealistic assumptions:
- BRT-lite can match the capacity of light rail; and
- other forms of BRT have the same space-needs as BRT-lite.
High standard BRT in Wellington will need four lanes at all stops and throughout the central area.
Canberra is moving straight from conventional buses to light rail, despite wide streets and low densities. We conclude that Canberra:
- takes a more proactive approach than simply reserving a route; and
- has a clear understanding of BRT and light rail differences.
Buses.
Buses and light rail must be considered together. Light rail cannot reasonably take over all public transport in the central area (which is probably also true of BRT).
Buses and light rail cannot share lanes at stops because buses delay light rail too much. Wellington’s passenger numbers are probably already too high to share lanes at all. Passengers on the existing Brooklyn or Hataitai services cannot reasonably transfer to light rail (where to put the hub, only 1–2 stops on the tram).
Light rail run on the golden mile throughout would probably be unwise (bus access, commercial access, clearance from parking and the cost of services diversions). Buses are already established, making it a logical route for the remaining buses. This suggests a reasonable combination giving passengers multiple options:
- Buses on the golden mile, running about every two minutes and generally using existing stops. Buses would provide good services for those preferring to ride rather than walk, running frequently to the next hub but more infrequently on longer routes.
- Light rail running generally on the waterfront, faster and with widely spaced stops, initially running every five or six minutes.
- Hubs at both ends of the CBD, and perhaps also at Midland Park.
Route and timetable design can optimize for minimum travel time and to minimize hub delays longer than the time-savings on light rail.
Local bus capacity in the central city could be permanently reduced to a maximum of about 40 bus/hr, carrying say 2000 passengers an hour. Buses can run about every two minutes (half the present-day inter-peak flow), A blend of routes can ensure that few passengers have to wait long.
Cost.
It is a mistake to put too much weight on the capital cost of light rail: there are substantial operating-cost savings.
Figures from Montpellier (population 384,000) in 2008 give costs per passenger boarding (How to Deliver Public Transport on Reduced Budget):
| Capital | Operating | Total | |
|---|---|---|---|
| Tram | €0.93 | €0.53 | €1.46 |
| Bus | €0.49 | €1.61 | €2.12 |
A 63 metre tram can carry 420 people as comfortably as a three-axle bus can carry 70, and at double the speed. This makes driver productivity about a 12-fold improvement.
Economics.
Wellington’s peak-hour bus patronage on the golden mile is up to 6000 passengers and hour, already more than enough to justify light rail. This is a FIT estimate, southbound at the Supreme Court, from Greater Wellington screen-line surveys and a Douglas Economics survey of Railway Station transfers.
If present-day buses are carrying up to 6000 passenger an hour, and future buses will carry up to about 2000 pass/hr, upwards of 4000 pass/hr will use light rail.
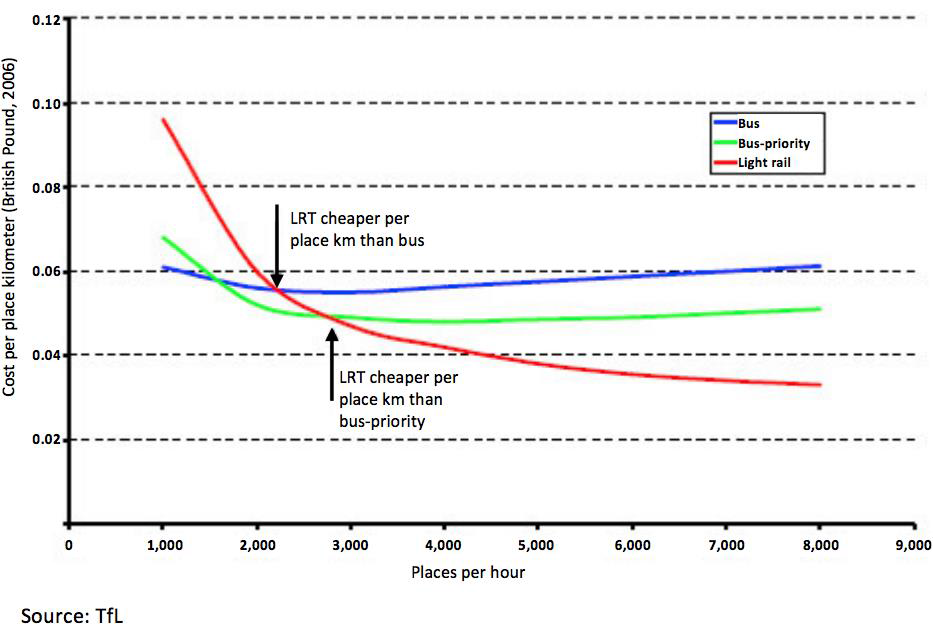
Comparison between bus and light rail cost of ownership shows that light rail costs break even with buses (places/hour: standing and seated passenger-spaces available) at about 2200 pass/hr, and at 4000 pass/hr are around three quarters of bus costs (Emerging Technologies for Rapid Transit, Part I page 12).

Much-improved public transport in Auckland—electrified rail and the North Shore Busway—are generating rapid patronage growth. Both are seeing 20% annual growth, and running into capacity limits.
This indicates suppressed demand, and often happens with much-improved public transport. A common problem on new light rail systems is insufficient trams, sometimes needing costly vehicle-leasing. For example, Monpellier in France, Bergen in Norway, and Dublin in Ireland all under-estimated their initial ridership (Auckland findings).
A 20% annual growth is a doubling in under four years, so if light rail in Wellington opened in 2027, it might initially carry 4000 pass/hr, then reach 8000 pass/hr in 2031. If this were to happen, an initial five minute service would be insufficient, having a capacity of only 5000 pass/hr.