Other FIT Wellington pages:
- A New Public Transport Approach
- A Suggested Route
- Advancing Light Rail for Wellington
- Advocacy or Consultancy
- Are we on track
- Art of Light Rail Insertion
- Auckland Light Rail Options
- Briefing to Transport Minister
- Bus and Light Rail in Central Wellington
- Bus Rapid Transit is Unsuitable
- By the Numbers
- Can Light Rail Attract Enough Demand
- City of Well Connected Communities
- Comparing Canberra and Wellington
- Congestion Free Wellington
- Draft GPS on Land Transport
- Estimating Travel Time
- FIT Wellington
- Funding Light Rail
- Glossary
- Golden Mile Trial
- Letter to Capital Magazine
- LGWM Options Feedback
- LGWM Personal Submission
- LGWM Submission
- Light Rail Costs
- Light Rail Design Brief
- Light Rail Options Survey
- Light Rail Planning Assumptions
- Light Rail to Lincolnshire Farms
- Making Tram-Train Work
- Mass Rapid Transit in Wellington
- Mass Rapid Transit Talking Points 2026
- Ministerial Talking Points
- Move More People with Fewer Vehicles
- Moving on from LGWM
- Myth Busters
- N2A Talking Points
- NZTA Talking Points
- Open Letter on Trackless Trams
- Open Letter to LGWM
- Paul Swain Monday 1 February 2016
- Planning Principles
- Public Transport in Wellington
- Public Transport Spine Issues
- Public Transport Spine Study
- Public Transport Spine Workshop
- SH 1 Wellington Improvements
- Spatial Plan Submission
- Submission on Harbour Quays Proposal
- The Case for Light Rail
- Three Minute Summary
- Towards Low Emission Cities
- Track Gauge
- What Makes Light Rail Succeed
- What Next for Transport in Wellington
- Workshop Code of Conduct
On this page… (hide)
- 1. What is light rail? The short version!
- 2. What is light rail? The long version!
- 3. Is Wellington big enough for light rail?
- 4. Why light rail?
- 5. Why light rail now?
- 6. How do you integrate light rail into the wider transport landscape?
- 7. Why does the inner city route option go along Panama Street?
- 8. What about a Willis Street, Manners Street, Courtenay Place, Basin route?
- 9. Why are light rail stops widely spaced?
- 10. Why did the spine study reject light rail?
- 11. Could BRT as proposed be upgraded to light rail in the future?
- 12. What is the difference between trams and light rail?
QWhat is light rail? The short version!
Light rail is a form of public transport providing fast, efficient, clean service to people living in urban areas. It uses electric vehicles, running on tracks in existing roads, separated from, and with priority over, other road traffic. It’s designed to carry lots of people, with connections to buses and suburban trains at major interchanges. One multi-segment light rail vehicle can do the work of 5 or more buses.

▴ French city of Le Mans: long vehicles, lots of doors, a baby stroller, station integrated with buildings, pavement, street (photo © Greg Thompson, used with permission)
QWhat is light rail? The long version!
Whenever you ask people living in cities what they want from their public transport service, you get the same answers:
- We need to put public transport where lots of people are;
- We need to make sure that public transport is there when people need it; and
- We need to make sure the total trip time is reasonably fast and really reliable.
Experience shows that when cities do this, many people switch from their cars to public transport. They also view the public transport service as one of the things that makes their city a great place to live.
Light rail was devised in Europe in the 1970s, as a way to create a public transport service that meets these needs. Light rail operates on tracks embedded in or beside existing streets, using rolling-stock similar to trams, but with higher capacity, usually on a dedicated right-of-way. It uses either single tramcars or multiple segments joined together to form a street-train.
The first modern light rail line in North America opened in 1978, for the Commonwealth Games in Edmonton, Canada. Since then, installation costs have fallen steadily and the quality of service has got better and better. Light rail is highly configurable and can be tailored to meet the needs of a wide range of urban environments.
We now know that a successful light rail system has to fulfil 5 design goals:
- Tie the city together.
- Light rail lines typically extend from urban fringe to urban fringe via the city centre.
- Use high-performance transit vehicles.
- That means large capacities, all-door entry, train-style off-board (e.g. on-platform) fare payment, level boarding, and signal priority at intersections.
- Have widely spaced stops.
- Light rail stops are spaced far enough apart to improve travel times, but they’re placed at critical transfer points with feeder buses or other major lines.
- Reach major destinations.
- A given for good public transport, but light rail lines emphasise access to education campuses, office complexes, hospitals, and shopping areas, in addition to major suburbs and the CBD.
- Form the core of an integrated public transport network.
- Bus lines are reconfigured to serve major light rail stops, and fare programmes encourage easy transfers from mode to mode, including suburban rail services.
QIs Wellington big enough for light rail?
Light rail’s critics say that Wellington’s population is too small.
There are light rail systems in hundreds of cities all over the world and many more are under construction.
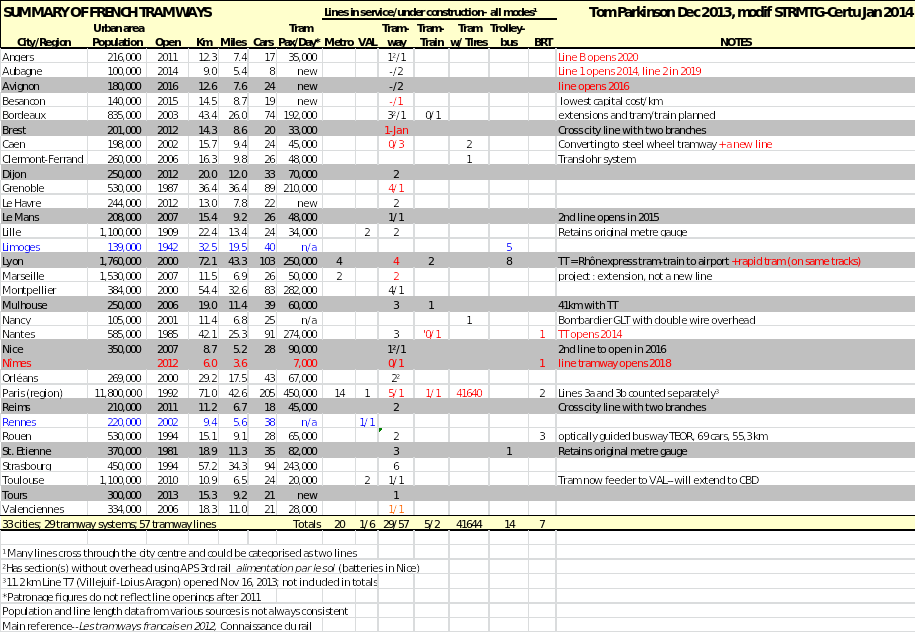
Light rail systems are operating cost-effectively in cities of all sizes, from a population of 100,000 up. For example, of the 27 French tram systems in operation or under construction, 14 are operating in cities with less than 400,000 population and five are in cities of under 200,000 population. A single line, which is where Wellington would start, typically carries up to 10,000 people per km.
Wellington city (population about 190,000) serves a wider Greater Wellington population of about 490,000.
One reason light rail is well-suited to smaller cities, like Wellington, is its flexible capacity. To increase capacity, the operator simply adds another segment to an existing tram. This avoids most of the cost other urban transport modes incur of adding another vehicle and another driver.
source data Δ (© Tom Parkinson, used with permission)
Once cities reach Wellington’s size and public transport ridership, light rail becomes a more cost-effective infrastructure investment than buses on high demand corridors. This is because while the up-front cost is high, the marginal cost of adding capacity is low. It’s comparatively inexpensive to make trams longer (still with only one driver) or to increase service frequency. This means light rail, unlike buses, is a congestion-free solution. When roads become congested, everyone experiences congestion. When light rail demand grows, the trams get more crowded, more capacity is added, and the schedule is unaffected.
Continuous improvement to the bus service in Wellington will deliver incremental gains. Future-proofing Wellington’s infrastructure to support a vibrant and growing population and commercial centre requires more than this. A step change in performance is achievable, but it requires a paradigm shift, which our research indicates that light rail can now deliver.
Wellington has talked about light rail since the early 1990s. Although the time has not been right up until now, the idea has not gone away. That in itself tells a story.
Now we have a limited window of opportunity to review this option with an open mind, before decisions around the Basin Reserve are made that preclude us considering the full range of options for another 25 years.
QHow do you integrate light rail into the wider transport landscape?
The best way forward is to adopt A New Public Transport Approach as a “straw man”. Those considering options for the Basin Reserve can test their proposals in light of our proposal, noting that if adopted, our proposal makes the Basin problem less complex. Those developing the BRT business case would include the light rail proposal as an option. And the proposal needs close scrutiny, to identify potential show-stoppers and how these could be addressed. This would include considering the route options we have proposed, assessing their strengths and weaknesses, and identifying a preferred route for in-depth study.
To meet the 2030 goal, construction would need to start by 2020.
QWhy does the inner city route option go along Panama Street?
Inner City Map shows a dotted line on Lambton Quay south of Panama Street.

Between Panama and Hunter streets, Lambton Quay is 2 lanes wide, narrowing to one lane between Hunter and Willis streets. This means that to provide a 2-track dedicated right-of-way along that stretch, the buses currently running there must be re-routed. There is no problem north of Panama St because we can use the 2 west (Terrace) side lanes for light rail and the 2 east side lanes for buses and other vehicles.
It is highly desirable from an amenity point of view to continue light rail along Lambton Quay. It would make the south end of Lambton Quay a pedestrian-friendly zone and reduce noise and pollution from the diesel buses. It would also be faster, eliminating the sharp turn onto Panama St.
However, there are 3 potential obstacles:
- The buses using that part of Lambton Quay and Hunter St, although they will be fewer in number once light rail is built, have to go somewhere. One option is to use Customhouse Quay north of Willis St, then Grey St (northbound) and Panama St (southbound). The feasibility of this route needs further investigation.
- A large number of underground services at the corner of Willis St and Lambton Quay would need to be relocated. At this stage, we do not have enough information to estimate the potential cost of this work.
- Lambton Quay between Hunter and Willis streets cannot easily be widened to accommodate 2 light rail tracks (each lane is 2.9m wide). The best option at the Old Bank building is to run the southbound track on Hunter St and northbound track on Willeston St and Lambton Quay. We do not see width as a problem—rail lines in Europe fit in streets as narrow as 9.1 metres, carrying over 100,000 passengers a day.
Once past Lambton Quay onto Hunter St and Willeston St, there are no significant problems turning onto and off Jervois Quay.
The proposed Panama St option is the technically conservative one. If the full Lambton Quay route proves feasible and affordable, this would be the preferred path for this option.
QWhat about a Willis Street, Manners Street, Courtenay Place, Basin route?
This is the route recommended in the PTSS and a number of earlier studies. This route is not “wrong”—it just uses different design parameters to those we have used. The options we have developed give priority to a number of factors, including:
- To make the service fast and reliable, run light rail on a dedicated right-of-way where possible, especially in the CBD. A Willis–Manners St route would require buses and trams to share the same lane in both directions, which introduces the risk of unplanned delay to the light rail service.
- Light rail needs to go where lots of people are and we gave preference to the high demand generated by the Massey University campus on Wallace Street, over the expected future demand on Adelaide Road south of the Basin.
- Now that the High Court has rejected NZTA’s plan for a Basin flyover, there is at present no solution to the problem of improving traffic flow around the Basin. By removing light rail from the mix, the traffic problem at the Basin becomes smaller and potentially more tractable.
- Use of a dedicated light rail right-of-way means there would be minimal disruption to existing bus services during the construction period.
We have shown that there are viable alternatives to the route proposed in the PTSS, and we consider that these deserve consideration, as they are better value for money. We have no view on which option would be the best route.
QWhy are light rail stops widely spaced?
The aim is to place stops at the points of highest demand.
Unlike buses, which generally stop often, successful light rail lines have widely spaced stops. Stop placement is a trade-off between geography and chronology. If stops are too far apart, ridership declines, because it becomes too inconvenient to get to a station. On the other hand, if stops are too close together, ridership also declines, because frequent stops make the trip take too long — every stop adds about a minute to the journey.
We also know that light rail stops have a halo effect — attracting economic development around the stations. The ideal inter-stop distance is where the halo from one stop touches or overlaps slightly with that of the next stop. The data tell us that a halo extends to a radius of about 400m around a stop, giving a preferred inter-stop distance of about 700–800m. Where population densities are high, such as in the CBD, this may be reduced to 600m. Where stops are more than 800m apart, an economic dead zone tends to develop, because for most people, access requires a car.
The proposed Railway Station to Wellington Airport line is 8.3 km long, with an average inter-stop distance of 692m. Removing one stop would make the average inter-stop distance 755m.
QWhy did the spine study reject light rail?
The PTSS considered the option of light rail for Wellington and found it was high cost ($938m), low benefit (less than half that of the BRT proposal). To understand this conclusion, we can assess the proposed light rail route against the requirements in the Art of Light Rail Insertion. PTSS assessed against requirements compares how well the PTSS light rail proposal meets these requirements.
|
Requirement |
PTSS |
Comment on PTSS |
|
Tie the city together |
✗ ✗ |
Chosen route divided and incoherent with minimal interchanges Slow trips because most routes are shared with buses |
|
Require high-performance vehicles |
✓ ✓ |
Modern modular-construction light rail vehicles with high passenger-carrying capacity |
|
Have widely spaced stops |
✗ ✗ |
Impractical on a route shared with buses |
|
Reach major destinations |
✗ |
Missed destinations include the Airport, education and recreation centres and higher-density residential and mixed-use areas (Newtown, Mt Cook and Te Aro) |
|
Form the core of an integrated network |
✗ |
Little attempt to increase system-wide trip speeds or integrate with rail or bus services |
PTSS assessed against requirements shows we should not be surprised the Spine Study found the light rail proposal was low benefit.
The route selection is poor, involving a Y shape with one leg going to Hataitai/Kilbirnie and one leg going to Newtown. The consequence is to impose an unnecessary $200M cost on light rail for a second Mt Victoria tunnel along a route that doesn’t align well with high growth areas such as Te Aro, Newtown and Kilbirnie. As a consequence the modelling does not pick up higher patronage benefits from growth areas. The frequency of service south of the split is halved on each leg, making it less attractive than an unsplit route.
Also, questionable assumptions in the modelling seriously understate the benefits of light rail. It assumes few people shift out of their cars on to light rail and it ignores international experience that introducing light rail can achieve an immediate growth in public transport patronage of up to 25% due to increased service standards, which result in reduced congestion for all road users with significant time saving benefit. The PTSS ignores land use benefits and value uplift from intensification around light rail transit nodes and corridors as experienced overseas. It ignores the greater capacity of light rail.
The operating costs for light rail in the study were also inflated. They included maintenance of rail tracks which may be less than road maintenance costs created by the proposed double-decker buses now planned. These large heavy vehicles were not predicted in the study. Staffing costs were also cited to be more expensive for light rail where, in fact, costs will be lower: a single driver can operate a multi-segment light rail vehicle carrying high passenger loads which would otherwise require multiple buses, each with its driver. The proposed route was also intrinsically and unnecessarily high cost. All these factors combine to make the Spine Study’s costs for light rail unnecessarily expensive.
Given the light rail route chosen, the Spine Study’s cost–benefit analysis correctly found that the proposal did not stack up economically.
However, the route options proposed in A New Public Transport Approach fully meet the requirements—delivering significantly higher benefits at lower cost. See FIT assessed against requirements.
|
Requirement |
FIT |
Comment on FIT |
|
Tie the city together |
✓ ✓ |
Chosen route link interchanges at the Railway Station, Manners St, Wellington Hospital and Kilbirnie Fast trips because high-capacity vehicles allow a high priority without delaying other traffic Existing golden mile route retained for congestion-free local buses |
|
Require high-performance vehicles |
✓ ✓ |
Modern modular-construction light rail vehicles with high passenger-carrying capacity |
|
Have widely spaced stops |
✓ ✓ |
Average stop spacing about 700 metres for fast running, on a dedicated right-of-way for most of the route |
|
Reach major destinations |
✓ ✓ |
Airport, Rita Angus home, Kilbirnie and Newtown shops, Mt Cook/Massey Campus, plus four interchanges |
|
Form the core of an integrated network |
✓ ✓ |
All bus routes running to or south of the Railway Station connect with light rail at one or more interchanges, with timetables aligned to minimise transfer times |
The proposed route would operate on a dedicated right-of-way for most of the line, which may make driverless operation practical by the time light rail comes to fruition in Wellington, thereby significantly reducing the operating cost.
This analysis shows light rail needs another look, based on a route that reflects current best practice.
QCould BRT as proposed be upgraded to light rail in the future?
Wellington’s golden mile (Lambton Quay, Willis Street, Manners Street) carries twice as many buses as a quality public transport corridor can handle.
Neither BRT nor light rail will work effectively if the same route also carries regular buses. This is because buses stop more often and there is not enough space for the faster BRT or light rail vehicles to pass, so the buses will delay them.
On the other hand, either BRT or light rail will be very inconvenient with no other buses. Many trips through the city centre will need two transfers.
The conclusion is that Wellington cannot have quality public transport until it has identified a ‘secondary spine’ through the CBD, so buses and BRT or light rail are fully separated.
Upgrading the proposed BRT route to light rail guarantees that light rail will perform poorly.
QWhat is the difference between trams and light rail?
Light rail is the modern version of the traditional tram. In most parts of the world, trams have been continuously developed into modern transport systems. But in some countries, including New Zealand, trams were not developed and eventually were discontinued, so now need to be introduced in a different form that is suitable for a modern city’s public transport needs. The last tram route in Wellington, from Thorndon to Newtown, closed in May 1964.
The defining differences between light rail and tram systems are exclusivity of right-of-way and stop spacing. Light rail is a form of rapid transit, designed to cover long distances quickly and predictably. Trams (streetcars) are essentially designed to do what local buses do.
| Light rail | Tram (streetcar) | |
| Purpose |
High capacity, high demand Strong peak for commuters |
Moderate capacity and demand Steady all day |
| Capacity |
1–4 car units ~ 125 pass/car (~ 60 seated)
|
1 or 2 car trams ~ 120 pass/car (~ 30 seated)
|
| Design |
Exclusive or semi-exclusive right-of-way (limited mixed flow)
|
Primarily semi-exclusive or mixed-flow with traffic
|
| Stop spacing |
600–800 metres or more ~ limited stop/express stops may be closer together in the CBD |
200–400 metres ~ local/limited stop short rapid sections are the exception |
| Control |
track signals, traffic signal pre-emption grade separation at major intersections |
traffic signals, with signal priority no grade separation |
| Curves |
minimum radius >~ 25.9 metres |
minimum radius ~< 18.3 metres |
| Construction |
full depth ~ 1–2 metres utilities relocated |
shallow slab ~< 0.5 metres minor/no utility relocation |
For illustrative examples and more information on the similarities and differences, see Streetcar and Light Rail Characteristics.