Other FIT Wellington pages:
- A New Public Transport Approach
- A Suggested Route
- Advancing Light Rail for Wellington
- Advocacy or Consultancy
- Are we on track
- Art of Light Rail Insertion
- Auckland Light Rail Options
- Briefing to Transport Minister
- Bus and Light Rail in Central Wellington
- Bus Rapid Transit is Unsuitable
- By the Numbers
- Can Light Rail Attract Enough Demand
- City of Well Connected Communities
- Comparing Canberra and Wellington
- Congestion Free Wellington
- Draft GPS on Land Transport
- FIT Wellington
- Funding Light Rail
- Glossary
- Golden Mile Trial
- Letter to Capital Magazine
- LGWM Options Feedback
- LGWM Personal Submission
- LGWM Submission
- Light Rail Costs
- Light Rail Design Brief
- Light Rail FAQ
- Light Rail Options Survey
- Light Rail Planning Assumptions
- Light Rail to Lincolnshire Farms
- Making Tram-Train Work
- Mass Rapid Transit in Wellington
- Mass Rapid Transit Talking Points 2026
- Ministerial Talking Points
- Move More People with Fewer Vehicles
- Moving on from LGWM
- Myth Busters
- N2A Talking Points
- NZTA Talking Points
- Open Letter on Trackless Trams
- Open Letter to LGWM
- Paul Swain Monday 1 February 2016
- Planning Principles
- Public Transport in Wellington
- Public Transport Spine Issues
- Public Transport Spine Study
- Public Transport Spine Workshop
- SH 1 Wellington Improvements
- Spatial Plan Submission
- Submission on Harbour Quays Proposal
- The Case for Light Rail
- Three Minute Summary
- Towards Low Emission Cities
- Track Gauge
- What Makes Light Rail Succeed
- What Next for Transport in Wellington
- Workshop Code of Conduct
FITWellington.EstimatingTravelTime History
Hide minor edits - Show changes to markup
Assuming remodelled streets, optimised for light rail, the journey would take about 22 minutes at peak times and 25 minutes off-peak.
Assuming remodelled streets, optimized for light rail, the journey would take about 22 minutes at peak times and 25 minutes off-peak.
The average dwell time at stops is 20 s.
The average dwell time at stops is 20s.
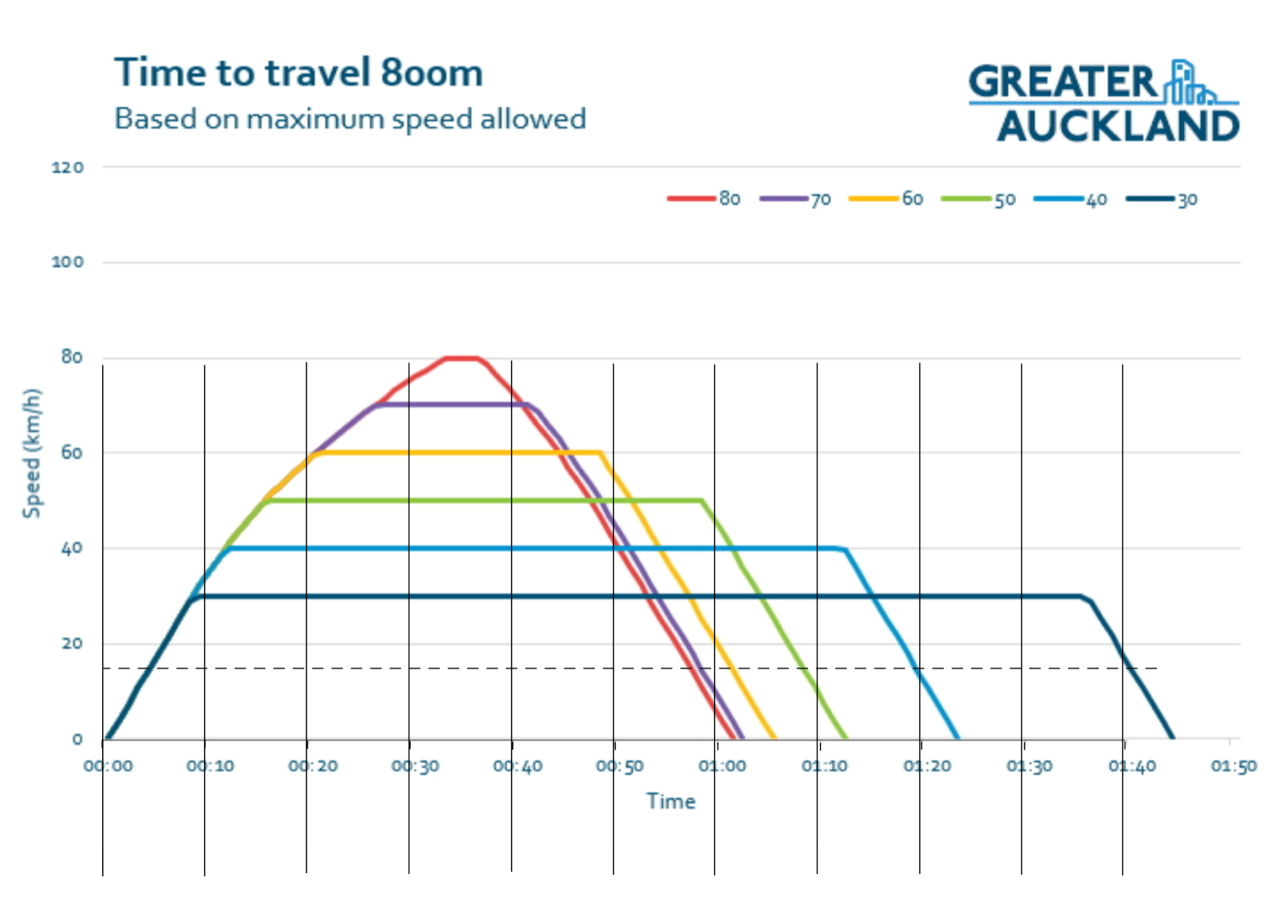
▴ Time to travel 800m / © Greater Auckland
▴ Time to travel 800m at different speeds / © Greater Auckland
Assuming remodelled streets optimised for light rail, the journey would take about 22 minutes at peak times and 25 minutes off-peak.
Assuming remodelled streets, optimised for light rail, the journey would take about 22 minutes at peak times and 25 minutes off-peak.
The journey would take about 22 minutes at peak times and 25 minutes off-peak.
Assuming remodelled streets optimised for light rail, the journey would take about 22 minutes at peak times and 25 minutes off-peak.
This also yields an estimated travel time of 19 minutes.
This also yields an estimated travel time of 19 minutes, at an average cruising speed of 43 kph.
To compute the distance travelled while accelerating and braking:
To compute the distance travelled while accelerating and braking (and therefore the distance travelled at cruising speed):
FIT assumes that Wellington will remodel streets the light rail vehicles run on, to maximize the cruising speed. This means in many cases removing lanes of traffic or parking, restricting turn movements, closing or redesigning intersections, and where possible, widening and improving the pedestrian footpaths. Stops will be located about every 800m, but in reality will be at convenient nodes or logical locations that best fit the fabric of the city.
FIT assumes that Wellington will remodel all streets the light rail vehicles run on, to maximize the cruising speed. This means in many cases removing lanes of traffic or parking, restricting turn movements, closing or redesigning intersections, and where possible, widening and improving the pedestrian footpaths. Stops will be located about every 800m, but in reality will be at convenient nodes or logical locations that best fit the fabric of the city.
This yields an estimated travel time of under 19 minutes.
This yields an estimated travel time of under 19 minutes.
This also yields an estimated travel time of 19 minutes.
During detailed route design it may be feasible to remodel the streets in a way that achieves higher cruising speeds than estimated and hence a shorter travel time. On the other hand, if Wellington decides not to optimize the streets for light rail, the travel time may be longer.
This also yields an estimated travel time of 19 minutes.
During detailed route design it may be feasible to remodel the streets in a way that achieves higher cruising speeds than estimated and hence a shorter travel time. On the other hand, if Wellington decides not to optimize the streets for light rail, the travel time may be longer. A more accurate travel time estimate depends on route design detail not available at this time.
In a graph of speed ds / dt (y-axis) as a function of time (x-axis), the area under the curve is the distance travelled:
In a graph of speed ds ∕ dt (y-axis) as a function of time (x-axis), the area under the curve is the distance travelled:
In a graph of speed ds∕dt (y-axis) as a function of time (x-axis), the area under the curve is the distance travelled:
In a graph of speed ds / dt (y-axis) as a function of time (x-axis), the area under the curve is the distance travelled:
In a graph of speed (y-axis) as a function of time (x-axis), the area under the curve is the distance travelled:
In a graph of speed ds∕dt (y-axis) as a function of time (x-axis), the area under the curve is the distance travelled:
In a graph of speed (y-axis) as a function of time (x-axis), the area under the curve is the distance travelled:
v = v0 + a t
s = s0 + v0 t + ½ a t2
a = 0
v2 = v02 + 2 a (s − s0)
The trip is 9.5 km.
The trip is 9.6 km.
As a second approximation, we estimate the expected average cruising speed for each leg of the route.
As a second approximation, we estimate the distance and expected average cruising speed for each leg of the route.
| Sports Centre | Miramar | 1.5 | 40.0 |
| Sports Centre | Miramar | 1.6 | 40.0 |
Equations of motion
To compute the time spent accelerating to and braking from the cruising speed:
v = v0 + a t
To compute the time spent at cruising speed between stops:
s = s0 + v0 t + ½ a t2
a = 0
To compute the distance travelled while accelerating and braking:
v2 = v02 + 2 a (s − s0)
Applying the equations of motion to compute the estimated travel time for a journey from the airport to railway station is left as an exercise for the reader.
This also yields an estimated travel time of under 19 minutes.
It may be feasible during detailed route design to remodel the streets in a way that achieves higher cruising speeds than estimated and hence a shorter travel time. On the other hand, if Wellington decides not to optimize the streets for light rail, the travel time may be longer.
This also yields an estimated travel time of 19 minutes.
During detailed route design it may be feasible to remodel the streets in a way that achieves higher cruising speeds than estimated and hence a shorter travel time. On the other hand, if Wellington decides not to optimize the streets for light rail, the travel time may be longer.
| WRS | Frank Kitts Park | 0.9 | 43.5 |
| Frank Kitts Park | Te Aro Park | 0.6 | 50.0 |
| WRS | Frank Kitts | 0.9 | 43.5 |
| Frank Kitts | Te Aro Park | 0.6 | 50.0 |
▴ Time to travel 800m / © Greater Auckland
FIT assumes that Wellington will remodel streets the light rail vehicles run on to maximize the cruising speed. This means in many cases removing lanes of traffic or parking, restricting turn movements, closing or redesigning intersections, and where possible, widening and improving the pedestrian footpaths. Stops will be located about every 800m, but in reality will be at convenient nodes or logical locations that best fit the fabric of the city.
▴ Time to travel 800m / © Greater Auckland
FIT assumes that Wellington will remodel streets the light rail vehicles run on, to maximize the cruising speed. This means in many cases removing lanes of traffic or parking, restricting turn movements, closing or redesigning intersections, and where possible, widening and improving the pedestrian footpaths. Stops will be located about every 800m, but in reality will be at convenient nodes or logical locations that best fit the fabric of the city.
As a second approximation, we can estimate the expected average cruising speed for each leg of the route.
As a second approximation, we estimate the expected average cruising speed for each leg of the route.
| From | To | Distance km | Cruise speed kph |
|---|---|---|---|
| WRS | Frank Kitts Park | 0.9 | 43.5 |
| Frank Kitts Park | Te Aro Park | 0.6 | 50.0 |
| Te Aro Park | Pukeahu | 0.9 | 50.0 |
| Pukeahu | King Street | 0.6 | 40.0 |
| King Street | Hospital | 0.6 | 50.0 |
| Hospital | Newtown | 0.7 | 37.5 |
| Newtown | Zoo | 0.7 | 40.0 |
| Zoo | Kilbirnie | 0.9 | 60.0 |
| Kilbirnie | Sports Centre | 0.6 | 40.0 |
| Sports Centre | Miramar | 1.5 | 40.0 |
| Miramar | Airport | 1.5 | 40.0 |
This also yields an estimated travel time of under 19 minutes.
It may be feasible during detailed route design to remodel the streets in a way that achieves higher cruising speeds than estimated and hence a shorter travel time. On the other hand, if Wellington decides not to optimize the streets for light rail, the travel time may be longer.
How long would a trip from the airport to the railway station take?
Cutting to the chase
The journey would take about 22 minutes at peak times and 25 minutes off-peak.
The estimated travel time is 19 minutes, plus on average 3 minutes’ waiting at peak times or 6 minutes’ waiting off-peak.
The trip is 9.5 km.
The vehicle acceleration rate is 1.0 m/s2.
The vehicle braking rate is −1.0 m/s2.
The average dwell time at stops is 20 s.
First approximation
The average cruising speed has a big influence on the travel time. The time to travel 800m between stops is about 65s at 60 kph, 72s at 50 kph, and 83s at 40 kph. For light rail running on-street, cities invest in remodelling the street to allow cruising speeds of 50 kph or more, where it is practical to do so.
▴ Time to travel 800m / © Greater Auckland
FIT assumes that Wellington will remodel streets the light rail vehicles run on to maximize the cruising speed. This means in many cases removing lanes of traffic or parking, restricting turn movements, closing or redesigning intersections, and where possible, widening and improving the pedestrian footpaths. Stops will be located about every 800m, but in reality will be at convenient nodes or logical locations that best fit the fabric of the city.
As a first approximation, assume Wellington will remodel the streets so that light rail can achieve an average cruising speed of 50 kph for half the line length and 40 kph for the other half. That is, the overall average cruising speed is 44 kph.
This yields an estimated travel time of under 19 minutes.
Second approximation
As a second approximation, we can estimate the expected average cruising speed for each leg of the route.